Chemical Dependence Treatment Program Admissions data
- 9 minsNortheastern University, Boston. Summer 2022
Background
The New York State Office of Addiction Services and Supports (OASAS) is responsible for overseeing one of the largest Substance Use Disorder care systems in the United States, comprising nearly 1,700 programs dedicated to prevention, treatment, and recovery services for more than 680,000 individuals annually. OASAS directly operates 12 Addiction Treatment Centers, providing inpatient and residential care to approximately 8,000 patients each year, staffed by a team of doctors, nurses, and clinical personnel. As the sole designated state agency, OASAS is accountable for coordinating state-federal relations regarding addiction services. Their core mission is to enhance the well-being of New Yorkers by spearheading a comprehensive addiction service system that incorporates prevention, treatment, harm reduction, and recovery. The approach is tailored to respond to the needs of individuals, grounded in data analysis, centered on patient care, and prioritizes equity. The aim is to envision a future where New York State is a safe and alcohol-free environment, devoid of chemical dependency and compulsive gambling.
The data
Treatment Program Admissions Data
The dataset provided contains information on the number of individuals admitted to New York State Office of Addiction Services and Supports (OASAS) certified treatment programs. This data is aggregated based on four categories: program category, county of the program location, age group of clients at admission, and the primary substance of misuse group. The program category represents the type of treatment program, such as outpatient, residential, or detoxification. The county of the program location refers to the geographic location of the treatment program within New York State. The age group of clients at admission refers to the age range of the individuals seeking treatment, with categories ranging from under 18 to over 65. Finally, the primary substance of misuse group refers to the primary substance that individuals report misusing, such as alcohol, opioids, or cocaine.
This dataset provides valuable information to policymakers and healthcare professionals, allowing them to better understand the prevalence of substance use disorders in New York State and to tailor treatment programs to meet the specific needs of different populations. By examining trends in admissions by program category, county location, age group, and primary substance of misuse, stakeholders can make informed decisions about allocating resources and improving access to treatment services.
Access the data here
Data analysis methods
CRISP-DM approach for data analysis
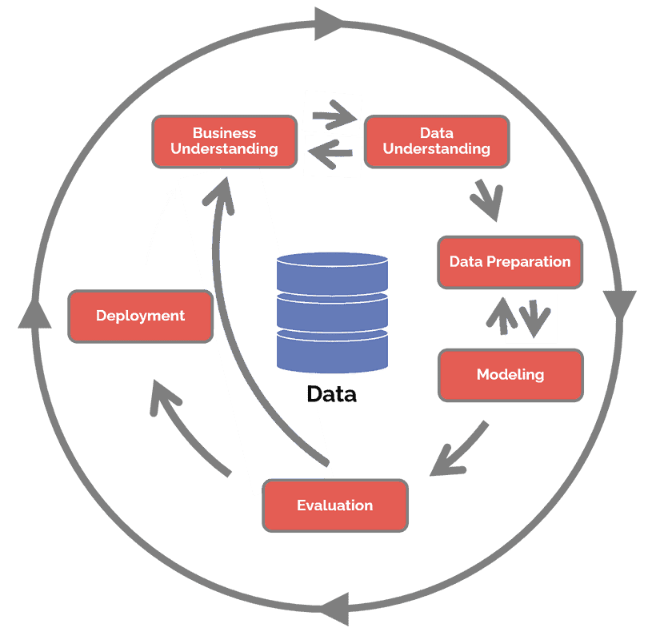
The CRoss Industry Standard Process for Data Mining (CRISP-DM) is a widely recognized and comprehensive process model that provides a structured framework for conducting data science projects. This approach offers a standardized methodology for data mining that is applicable across industries, making it an indispensable tool for data scientists and analysts. The CRISP-DM process model consists of six key stages that serve as a blueprint for managing data science projects. These stages are business understanding, data understanding, data preparation, modeling, evaluation, and deployment. The CRISP-DM process model provides a structured and systematic approach to data mining that enables data scientists to effectively manage complex data science projects.
This approach ensures that projects are aligned with business objectives and that the resulting models are actionable, effective, and sustainable over time.
-
Business understanding Analyzing the dataset can help identify trends and patterns in admissions to OASAS certified treatment programs. This information can be used to better understand the prevalence of substance use disorders in different regions and demographic groups. By identifying areas or groups with the highest rates of admissions, policymakers and healthcare professionals can target resources to those areas or populations that need them most. The data can be used to evaluate the effectiveness of existing treatment programs and to identify areas for improvement. By analyzing factors such as program category, primary substance of misuse, and age group, stakeholders can optimize treatment programs to better meet the needs of different populations. Additionally, it can also help identify areas or populations with low rates of admission to treatment programs. This information can be used to develop strategies to improve access to care for those who need it. The data can be used to evaluate the outcomes of treatment programs and to identify factors that contribute to successful outcomes. This information can be used to improve treatment programs and to develop new interventions that are more effective.
-
Data understanding The dataset includes data on the number of admissions to New York State Office of Addiction Services and Supports (OASAS) certified treatment programs. The dataset is organized by several categories, including program category, county of program location, age group of clients at admission, and primary substance of misuse group. Here is a more detailed breakdown of the contents of the dataset:
Program Category: This category includes several program types, such as outpatient, intensive outpatient, residential, and detoxification. These categories are used to classify the type of treatment program that the client was admitted to.
County of Program Location: This category includes the county where the treatment program is located. This information is used to identify the geographic distribution of admissions across the state.
Age Group of Clients at Admission: This category includes several age groups, such as 0-17, 18-24, 25-44, 45-64, and 65 and over. This information is used to identify patterns in admissions across different age groups.
Primary Substance of Misuse Group: This category includes several types of substances that are commonly misused, such as alcohol, opioids, cocaine, and marijuana. This information is used to identify the prevalence of different types of substance use disorders among clients.
-
Data Preparation The XML version of the OASAS dataset is loaded into Rstudio, a popular data analysis tool, and then converted into a dataframe for ease of analysis. The dataset consists of 92,907 rows and 8 features, which include the year, county of program location, program category, service type, age group, primary substance group, admissions, and response ID. Further, the data is analyzed for outliers and collinearity. Outliers are data points that lie far away from the typical range of values and can skew the results of statistical analyses. Collinearity refers to high correlations between predictor variables, which can make it difficult to identify the true relationship between variables. To identify potential outliers, the features that could potentially have outliers are analyzed, and z-scores are calculated for each data point. Z-scores represent the number of standard deviations a data point is away from the mean of the dataset. Data points with z-score values greater than 3 are considered to be outliers and are eliminated from the dataset. By eliminating outliers, the data is made more representative of the underlying population and can be used to draw more accurate conclusions. Additionally, analyzing for collinearity helps to ensure that the relationships between variables are accurately identified and that multiple variables are not being used to predict the same outcome.
Results and inferences
- Total number of reported admissions transpired each year from 2007 to 2020
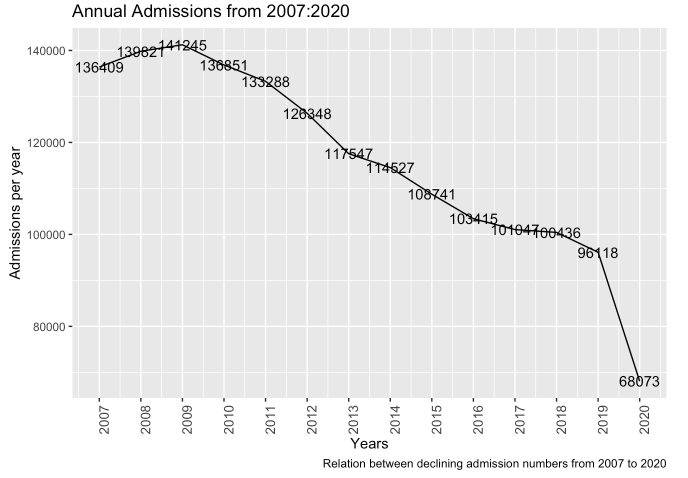
The line plot that displays the trend in admissions to OASAS-certified treatment programs from 2007 to 2020 provides some interesting inferences. First, we can observe that there has been a consistent decline in the number of admissions over this period. The decline is evident from the overall downward trend of the line plot. This decline is a positive development, as it may indicate a reduction in substance abuse and addiction, which in turn could have a positive impact on the health and well-being of individuals and communities. Secondly, the highest number of admissions was recorded in 2009, which may suggest a peak in substance abuse and addiction during this year. The decline in admissions after 2009 could indicate that measures taken to address substance abuse have been effective. However, it’s also important to note that the decline in admissions could also be due to changes in treatment practices or a shift in substance abuse patterns. Finally, the lowest number of admissions in the 14-year period was recorded in 2020. It’s possible that this lower admission rate could be a result of the COVID-19 pandemic and related disruptions to healthcare services. It’s important to monitor future trends to determine whether this decline persists beyond the pandemic.
- Percentage of admissions for each county
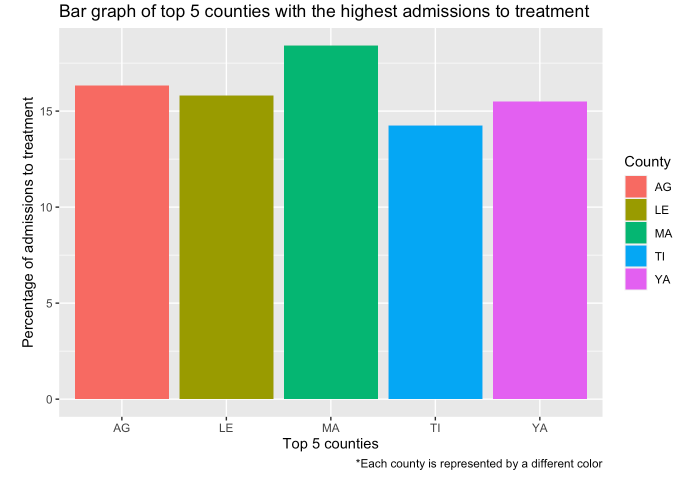
The bar plot generated from a subset of the OASAS admissions data represents the top five counties with the highest admission rates. The plot provides an easy-to-read visual representation of the percentage of admissions in these counties, making it easy to identify which counties have the highest rates. From the bar plot, we can see that Madison county has the highest percentage of admissions at approximately 18.4%. This suggests that there may be a higher incidence of substance abuse and addiction in this county than in others. The other four counties in the top five have slightly lower percentages of admissions ranging from 14% to 17%, indicating that they also have a significant number of admissions. It is important to note that this data represents a percentage of admissions and not the absolute number of admissions. Therefore, the higher percentage of admissions in Madison county does not necessarily mean that they have the highest number of admissions overall. The information provided by this bar plot can be useful in identifying which counties may require greater resources for substance abuse treatment and prevention efforts.
- Identification of which substance is the most prominent among each age group
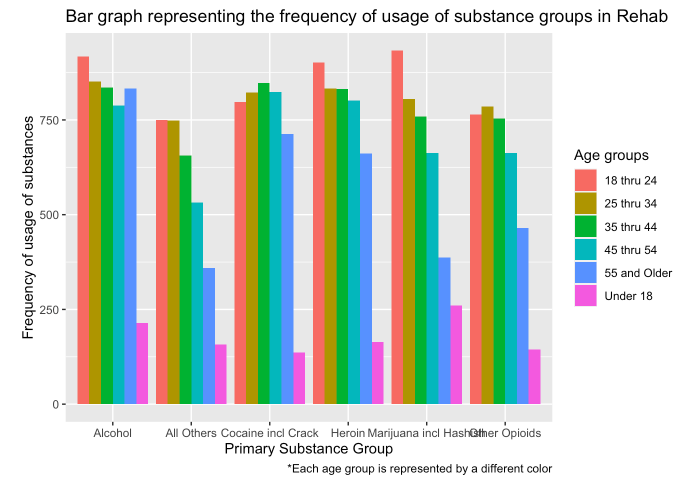
The above bar plot provides an overview of the primary substance groups that are commonly used across different age groups. The plot shows that the usage of substances varies across different age groups, with marijuana and alcohol being the most frequently used substances among the younger age groups while alcohol and cocaine being the most frequently used substances among the older age groups. This information can be used to tailor prevention and treatment programs based on the age group and the type of substance being used. For instance, programs aimed at reducing alcohol consumption may be more effective among older age groups, while programs aimed at reducing marijuana use may be more effective among the younger age groups. Additionally, this plot can help in identifying the substances that require more attention in terms of prevention and treatment efforts.

Amoolya Srinivasa
Bioinformatics Programmer at NYU Langone Health